Building an interactive Impact report for N-TUTORR
Why I’m writing about this
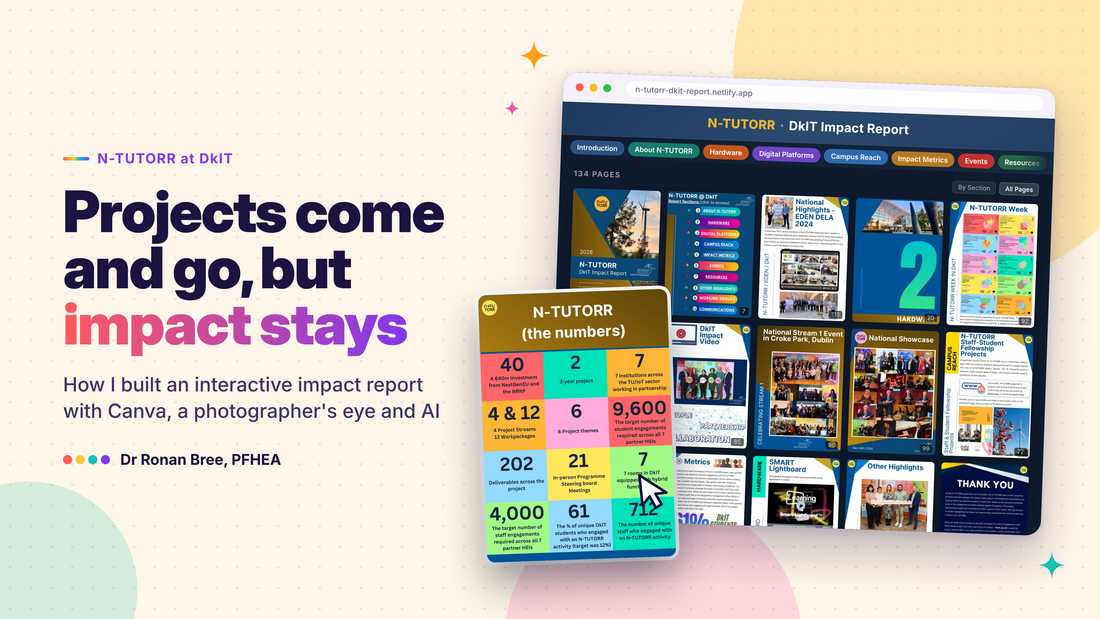
Since we launched DkIT’s interactive N-TUTORR impact report, a lot of people have been asking me, “How did you do it?” So I thought I’d provide an overview here! In recent years, I was DkIT’s Institutional Lead for N-TUTORR. If you haven’t come across it, N-TUTORR was a €40 million investment across the Technological Higher Education Sector in Ireland, supported by NextGenerationEU, with seven partner HEIs working together in a very cohesive way. It focused on transforming learning for our staff and students: building digital ecosystems along the way, supporting our students in partnership and empowering them in their learning, and developing staff professional development capabilities. So there was quite a mix, and it was a very large project! You can read more about it on transforminglearning.ie.
Impact isn’t something you add on at the end
When the project finished and the formal reporting was done (i.e. all reports returned to the Programme Management Office, the HEA and the EU), there was quite a lot of reflection from my point of view on the impact it has had locally and nationally. Looking back, I’ve spent a lot of my career trying to measure and see impact, and some platforms inspired this in recent years. The Educational Developers in Ireland Network’s (EDIN) Impact Analysis Tool is incredible for any project team, and I previously brought it to the Virtual Labs project steering board when we were commencing that project, so impact considerations came in from the beginning rather than being added on towards the end. During my secondment to the National Forum, I worked with colleagues on webinars around their impact-dedicated "insights documents", which are absolutely priceless for considering a project or team's impact. I’ll never forget a comment in one of them: sometimes you don’t actually see some aspects of the benefit until a while later, after the project is completed. With N-TUTORR, I could really relate to that, both during and after the project.
Why? Because it was the right thing to do
For this report, I wasn’t under any instruction to prepare or publish it. I felt it was the right thing to do, given the amount of input, effort and time so many people put in across our institution and nationally. I wanted to capture the momentum, the change and the opportunities that have taken place in our institution - because of the project, but also because of the community collaboration, and the way everyone jumped on board to support it. If you look through the report, you’ll get a sense of the breadth of impact this project has had here in DkIT. There’s a lot of quantitative data embedded throughout, and there are four pages of citations alone from outputs from our institution. But what comes through most for me is this: if you support a sector, align funding with a project and initiative, and have a strong, cohesive team with collaboration at the front of everything, you can accomplish a huge amount in a very short space of time. As it was such a big project, with stakeholders across many functional areas, I wanted a report people could jump in and out of, going straight to the pieces relevant to them, while also being able to update it over time, considering it as a 'living report'. I wanted a record I could point people to as queries came in too. And I didn’t want a big PDF that would sit in a folder somewhere and be left there. I wanted it to be interactive, with videos and various ways of displaying things.
Impact isn’t something you add on at the end
When the project finished and the formal reporting was done (i.e. all reports returned to the Programme Management Office, the HEA and the EU), there was quite a lot of reflection from my point of view on the impact it has had locally and nationally. Looking back, I’ve spent a lot of my career trying to measure and see impact, and some platforms inspired this in recent years. The Educational Developers in Ireland Network’s (EDIN) Impact Analysis Tool is incredible for any project team, and I previously brought it to the Virtual Labs project steering board when we were commencing that project, so impact considerations came in from the beginning rather than being added on towards the end. During my secondment to the National Forum, I worked with colleagues on webinars around their impact-dedicated "insights documents", which are absolutely priceless for considering a project or team's impact. I’ll never forget a comment in one of them: sometimes you don’t actually see some aspects of the benefit until a while later, after the project is completed. With N-TUTORR, I could really relate to that, both during and after the project.
Why? Because it was the right thing to do
For this report, I wasn’t under any instruction to prepare or publish it. I felt it was the right thing to do, given the amount of input, effort and time so many people put in across our institution and nationally. I wanted to capture the momentum, the change and the opportunities that have taken place in our institution - because of the project, but also because of the community collaboration, and the way everyone jumped on board to support it. If you look through the report, you’ll get a sense of the breadth of impact this project has had here in DkIT. There’s a lot of quantitative data embedded throughout, and there are four pages of citations alone from outputs from our institution. But what comes through most for me is this: if you support a sector, align funding with a project and initiative, and have a strong, cohesive team with collaboration at the front of everything, you can accomplish a huge amount in a very short space of time. As it was such a big project, with stakeholders across many functional areas, I wanted a report people could jump in and out of, going straight to the pieces relevant to them, while also being able to update it over time, considering it as a 'living report'. I wanted a record I could point people to as queries came in too. And I didn’t want a big PDF that would sit in a folder somewhere and be left there. I wanted it to be interactive, with videos and various ways of displaying things.
How it was developed...
Starting in Canva, with a photographer’s eye
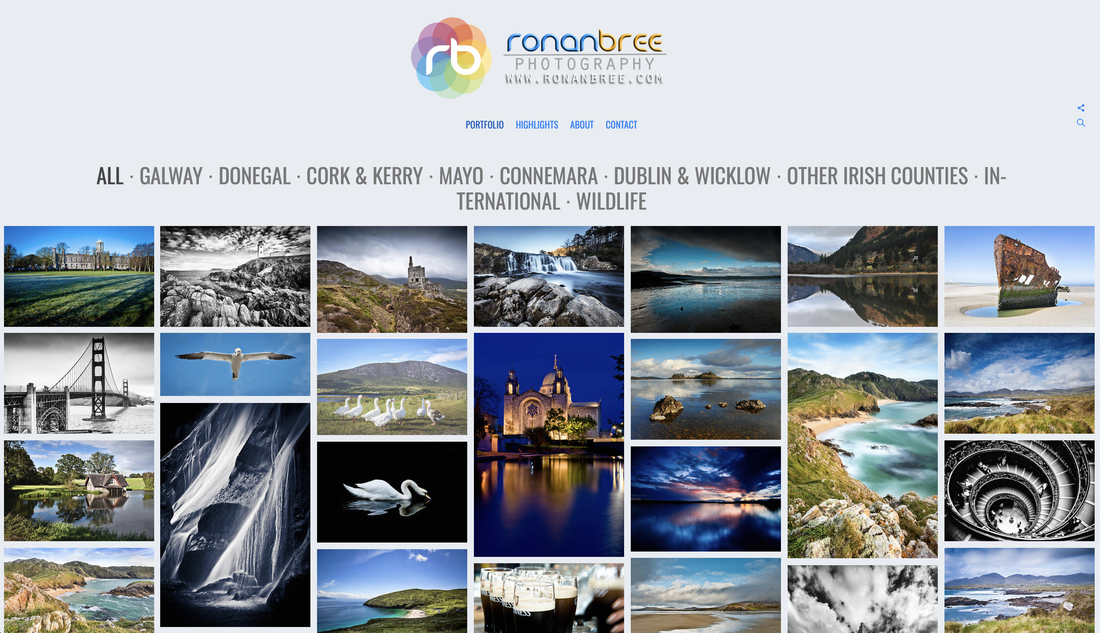
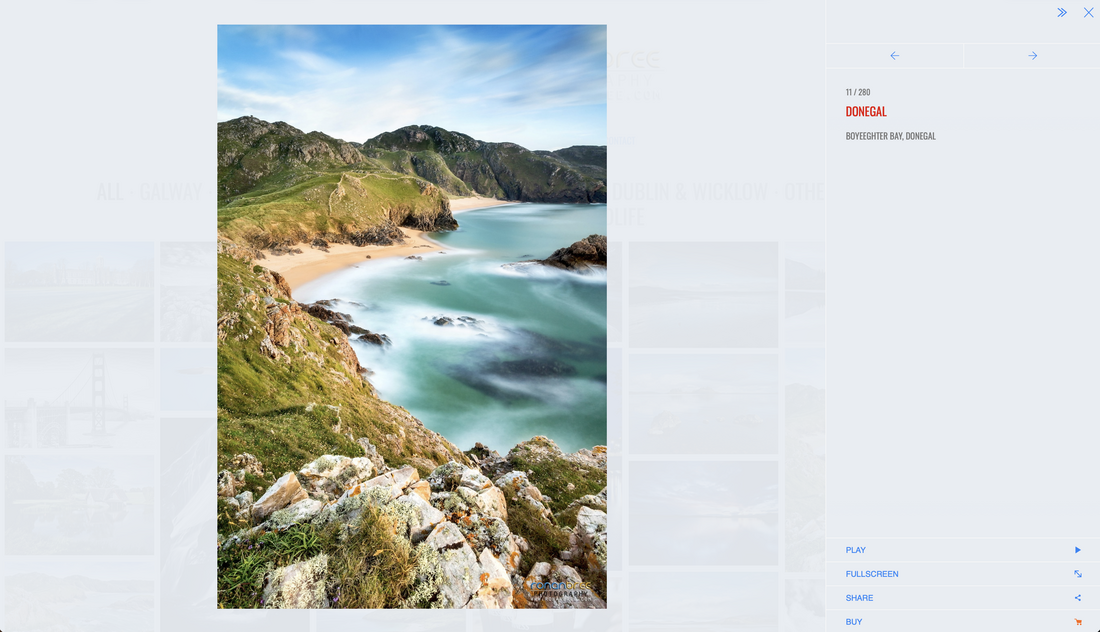
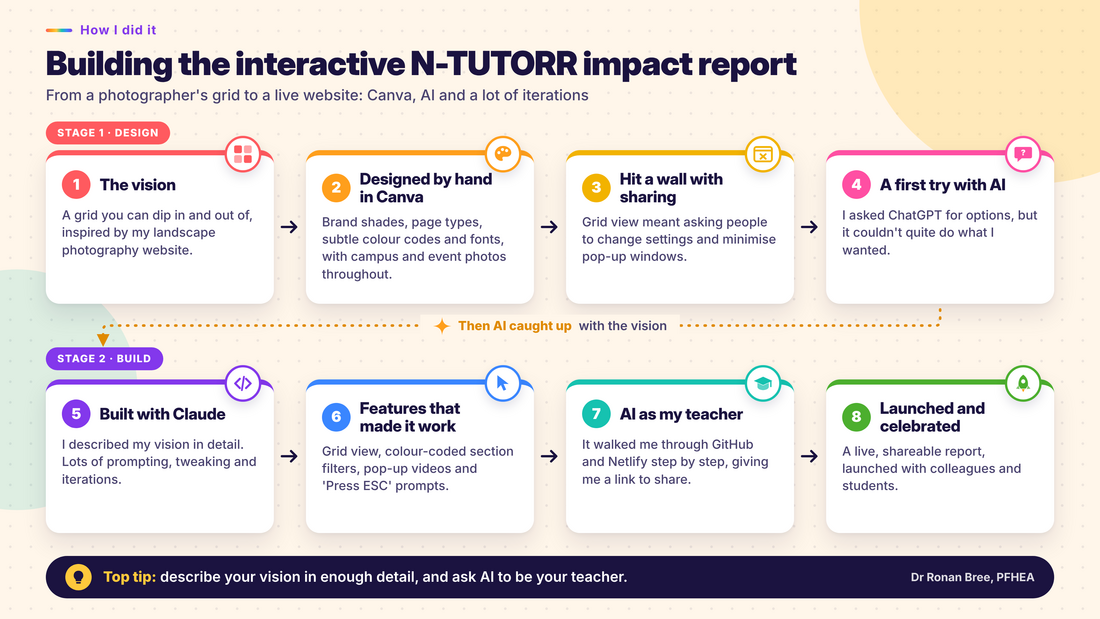
I began the report’s design in Canva, which had been an incredible tool for me throughout N-TUTORR. It helped me maintain the N-TUTORR brand across presentations, images and videos, and almost acted as a catalogue of our events (via the photos and videos uploaded there). It’s also a very user-friendly platform. Part of my journey in life has also involved digital photography, with landscape photography being a fun hobby. I’d previously built a website where you could click on an image in a grid, look at it, then click again to go back to the grid view. I really liked that feature, and wanted the same for the report: go into a page and come back out again quickly, rather than swiping through every page to get to a particular place. Hence, the design, layout, imagery, fonts and structure were all done manually in Canva (I didn’t use any template). I started with the institution’s brand shades, developed different page types for the content, and colour-coded various elements. It was also a lovely opportunity to showcase some of my photos of our stunning campus in Dundalk at different times of the year, including rooms and locations people mightn’t visit every day. And the images from all our events, and all the people involved, became a way to celebrate our community’s effort. Getting everything written up and uploaded to Canva took a serious amount of time, tweaking and checking. But once it was built, I found it difficult to share it in Canva’s grid view as the default 'view' style. I’d have to ask people to change settings, and there were pop-up windows they’d have to minimise too. While I’d praise Canva to the end of the earth, the options I had in mind wouldn’t really work there, and I didn’t like the idea of people having to minimise pop-up windows just to get into the report. It would be great if Canva let you share things in a grid view, as a default or as an option.
I began the report’s design in Canva, which had been an incredible tool for me throughout N-TUTORR. It helped me maintain the N-TUTORR brand across presentations, images and videos, and almost acted as a catalogue of our events (via the photos and videos uploaded there). It’s also a very user-friendly platform. Part of my journey in life has also involved digital photography, with landscape photography being a fun hobby. I’d previously built a website where you could click on an image in a grid, look at it, then click again to go back to the grid view. I really liked that feature, and wanted the same for the report: go into a page and come back out again quickly, rather than swiping through every page to get to a particular place. Hence, the design, layout, imagery, fonts and structure were all done manually in Canva (I didn’t use any template). I started with the institution’s brand shades, developed different page types for the content, and colour-coded various elements. It was also a lovely opportunity to showcase some of my photos of our stunning campus in Dundalk at different times of the year, including rooms and locations people mightn’t visit every day. And the images from all our events, and all the people involved, became a way to celebrate our community’s effort. Getting everything written up and uploaded to Canva took a serious amount of time, tweaking and checking. But once it was built, I found it difficult to share it in Canva’s grid view as the default 'view' style. I’d have to ask people to change settings, and there were pop-up windows they’d have to minimise too. While I’d praise Canva to the end of the earth, the options I had in mind wouldn’t really work there, and I didn’t like the idea of people having to minimise pop-up windows just to get into the report. It would be great if Canva let you share things in a grid view, as a default or as an option.
Bringing AI into the build
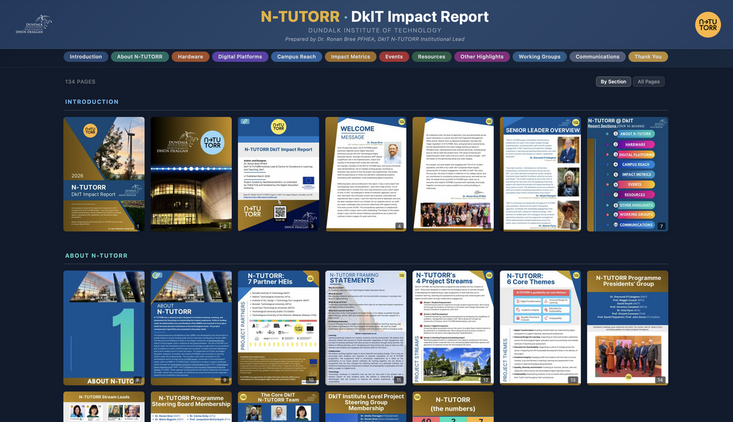
As I was close to completing the report, I started engaging with ChatGPT, asking whether I could do this or that in terms of displaying it online. But it wasn’t able to do exactly what I had in my mind, and I was very much thinking I’d have to go with Canva and point people on what to do. AI is developing at such a rapid pace, though. What I couldn’t do at the end of one academic year, I could do at the start of the next. When I came back to it, I used Claude, and I really worked with it – a huge amount of prompting, tweaking and iterations. It generated a set of files that gave people the grid view I wanted, with colour codes across the top so you could filter by section rather than going through the one document, and go back to the full report whenever you liked. I could put links as overlays "on top" of pages so people could click and watch video content that would open up, and add prompts like “press ESC to close” - the things a user might need to know as they go through it. What amazed me was that everything I had in my head, as long as I described it in enough detail, Claude was able to generate. I was just amazed at how quickly my vision could become a reality.
Ask AI to be your teacher
The other big learning for me was the technical side. At the time, I didn’t know how to get GitHub working, or how to make the Netlify app that would give me a web address to share. So I asked AI to guide me. I told it what I wanted to do, gave it a mission, and it effectively trained me, guiding me through the process I needed to follow. This is something I promote with a lot of colleagues who are maybe nervous or just starting out with AI: ask it to be the teacher or the trainer on a particular topic. You’d be amazed. So, in short: the design, layout, imagery, fonts and structure were all done manually in Canva. AI built the platform for people to engage with it - and the vision behind it all came from my photography website experience, and being able to go in and out as you wanted!
As I was close to completing the report, I started engaging with ChatGPT, asking whether I could do this or that in terms of displaying it online. But it wasn’t able to do exactly what I had in my mind, and I was very much thinking I’d have to go with Canva and point people on what to do. AI is developing at such a rapid pace, though. What I couldn’t do at the end of one academic year, I could do at the start of the next. When I came back to it, I used Claude, and I really worked with it – a huge amount of prompting, tweaking and iterations. It generated a set of files that gave people the grid view I wanted, with colour codes across the top so you could filter by section rather than going through the one document, and go back to the full report whenever you liked. I could put links as overlays "on top" of pages so people could click and watch video content that would open up, and add prompts like “press ESC to close” - the things a user might need to know as they go through it. What amazed me was that everything I had in my head, as long as I described it in enough detail, Claude was able to generate. I was just amazed at how quickly my vision could become a reality.
Ask AI to be your teacher
The other big learning for me was the technical side. At the time, I didn’t know how to get GitHub working, or how to make the Netlify app that would give me a web address to share. So I asked AI to guide me. I told it what I wanted to do, gave it a mission, and it effectively trained me, guiding me through the process I needed to follow. This is something I promote with a lot of colleagues who are maybe nervous or just starting out with AI: ask it to be the teacher or the trainer on a particular topic. You’d be amazed. So, in short: the design, layout, imagery, fonts and structure were all done manually in Canva. AI built the platform for people to engage with it - and the vision behind it all came from my photography website experience, and being able to go in and out as you wanted!
Launch day
We launched the report at a local event, opened by our Vice President for Academic Affairs and Registrar, Dr Sheila Flanagan, who was the project sponsor. A large number of colleagues attended from many functional areas, students were there too. It was really about celebrating our staff and students, and that partnership. You can read more in the DkIT news story. I’ve no doubt the project will continue to impact DkIT staff and students for many years to come, and that’s solely down to the vast collaboration that took place across our institution and nationally. It’s incredible to realise the impact of that. Please do have a look through the interactive report and you’ll see what we accomplished as an institution. I hope it gives you a sense of what’s possible when people come together.
A note on how this was written: This post draws entirely on my own experience of authoring the DkIT N-TUTORR impact report. It is built on my own personal experiences, reflections, ideas and structure. I dictated my thoughts section by section and used Claude to turn that dictation into written text, keeping my voice, thoughts and the points I'd highlighted as important. I then revised, edited and approved the final version, and the graphics were developed in a similar way. I take full responsibility for the content presented in this post.
View my LinkedIn profile